At COROS, we are continuously looking to improve your user experience and facilitate your training journey through easy-to-understand metrics and graphs. This is why we would like to introduce Training Status as part of our EvoLab ecosystem!
What Is Training Status?
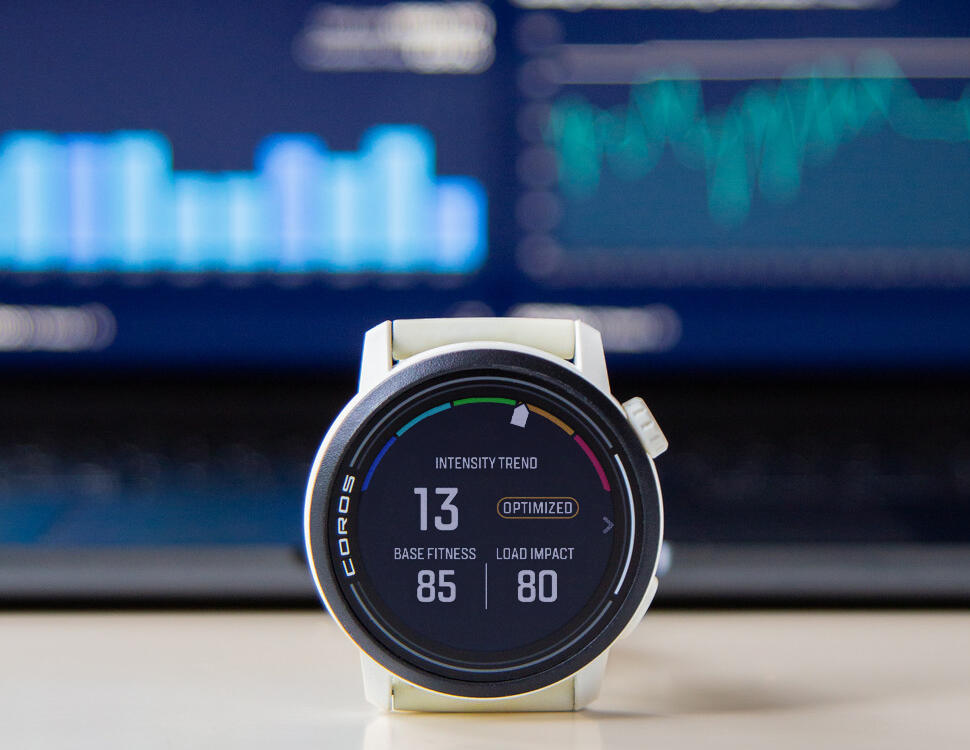
Training Status is a way to help you understand the impact of recent training on your body. This metric consists of 3 different metrics. Let’s define those:
- Base Fitness (42-day rolling average): Think of this as your long-term metric. It measures your ability to take on hard sessions from your long-term training. (42-day rolling average)
- Load Impact (7-day rolling average): This is your short-term metric. It measures the amount of impact brought to your body from short-term training. (7-day rolling average)
- Intensity Trend (24-day rolling average): This is the relation between short- and long-term workload. In short, Intensity Trend = Load Impact – Base Fitness.
If you look closely at the Intensity Trend value, you will notice that this very simple formula stands out: Intensity Trend = Load Impact – Base Fitness. A positive number means that your short-term training is higher than your long-term training, and vice-versa.
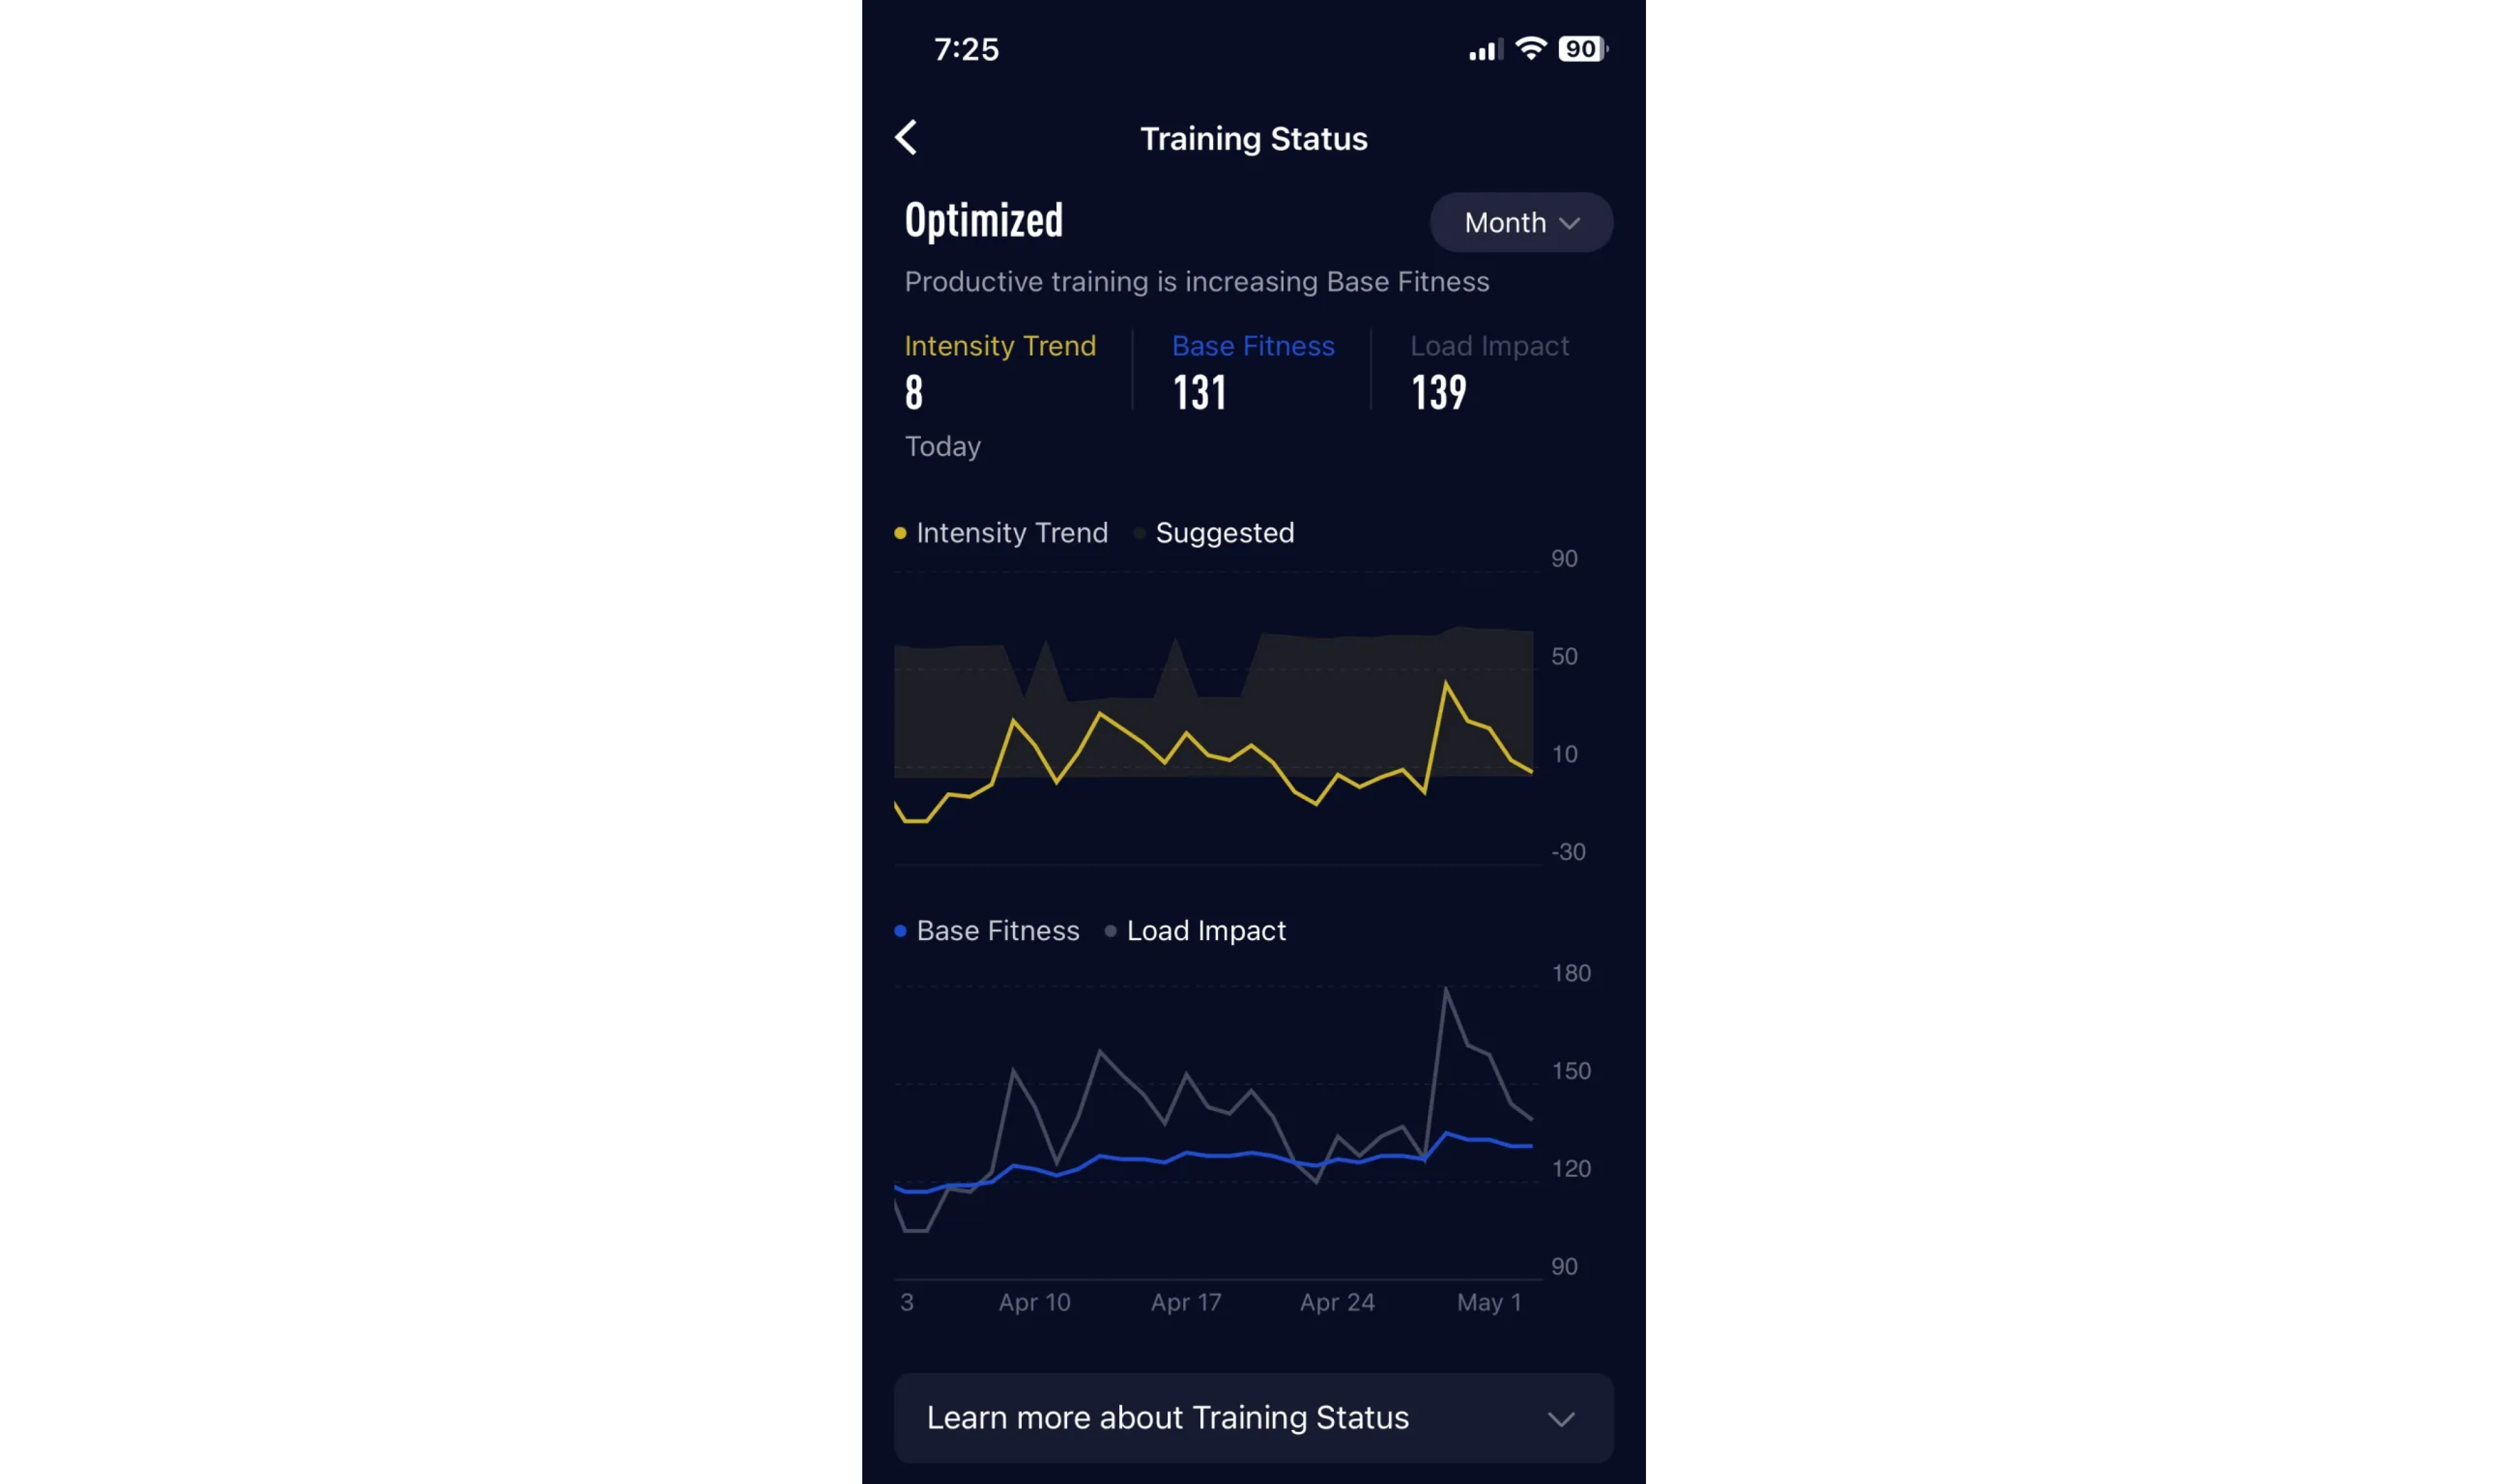 Training Status as seen from the COROS app.
How To Interpret Your Training Status?
Each Intensity Trend value comes with a term to help you interpret your current Training Status. Let’s take a look at each term you may encounter throughout your training.
- Excessive: Recent training may be overreaching or excessive
- Optimized: Base Fitness gradually increasing
- Maintaining: Moderate recent Training Load, maintaining Base Fitness
- Resuming: Recent training is gradually increasing your adaptation to higher training load
- Recovery: Ready for high-performance efforts
- Decreasing: Base Fitness rapidly declining
Each term mentioned above will be provided to you based on recent trends in your training, which is why they do not have any value associated with them. Instead, a recommended range is provided within the graph to let you know that reaching above it would lead to an increase risk of injury.
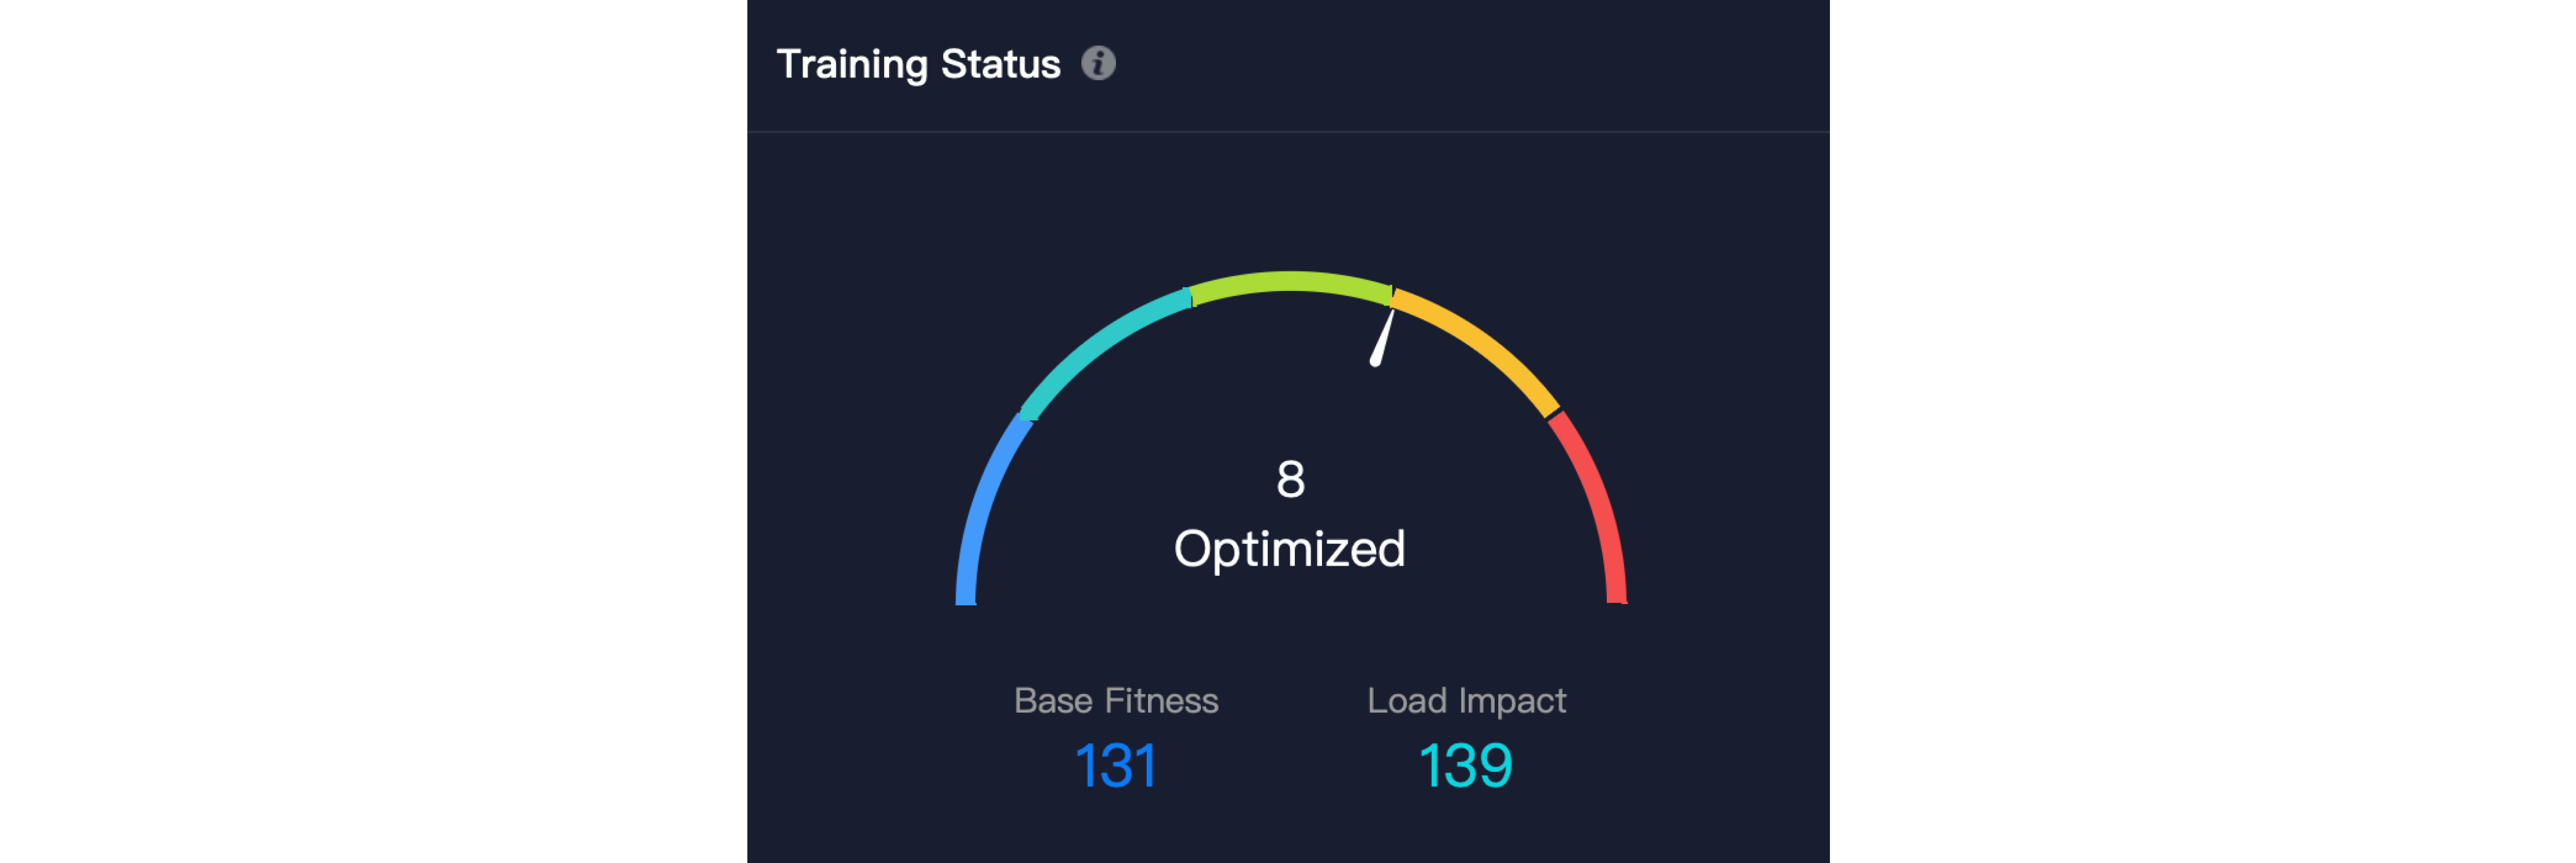 Quick Overview of Training Status from EvoLab.
User Case
Let’s take a look at the Training Status graph from EvoLab. The recommended range always begins at 0 and expands to a certain value depending on your training. Whenever you are within this range, your training is optimized. Reaching above would lead to an increase risk of injury while reaching below would lead to inefficient training.
For instance, this athlete seems to go through three different stages of training. Let’s break them down below.
 Training Status Graph from EvoLab.
- February: Load Impact and Base Fitness seem to be close to each other, leading to an Intensity Trend value close to 0. The training outcome then results in maintaining Base Fitness.
- March: Load Impact seems to be higher than Base Fitness, leading to an increase in Intensity Trend well within the recommended range. The training outcome as seen below is an increase in Base Fitness.
- April: Load Impact seems to be lower than Base Fitness, leading to negative values of Intensity Trend outside of the recommended range. The training outcome then is a decrease in Base Fitness.
More Questions?
If you wish to get individualized insights from your data, please feel free to email us at coach@coros.com, and we will be happy to help you in your training journey!


